
HQ Reporting
Your Entire Business.
One Dashboard.
Real-time sales analytics, AI-powered menu insights, product mix reporting, QR code management, and tenant-level financials — all accessible from anywhere in the cloud.

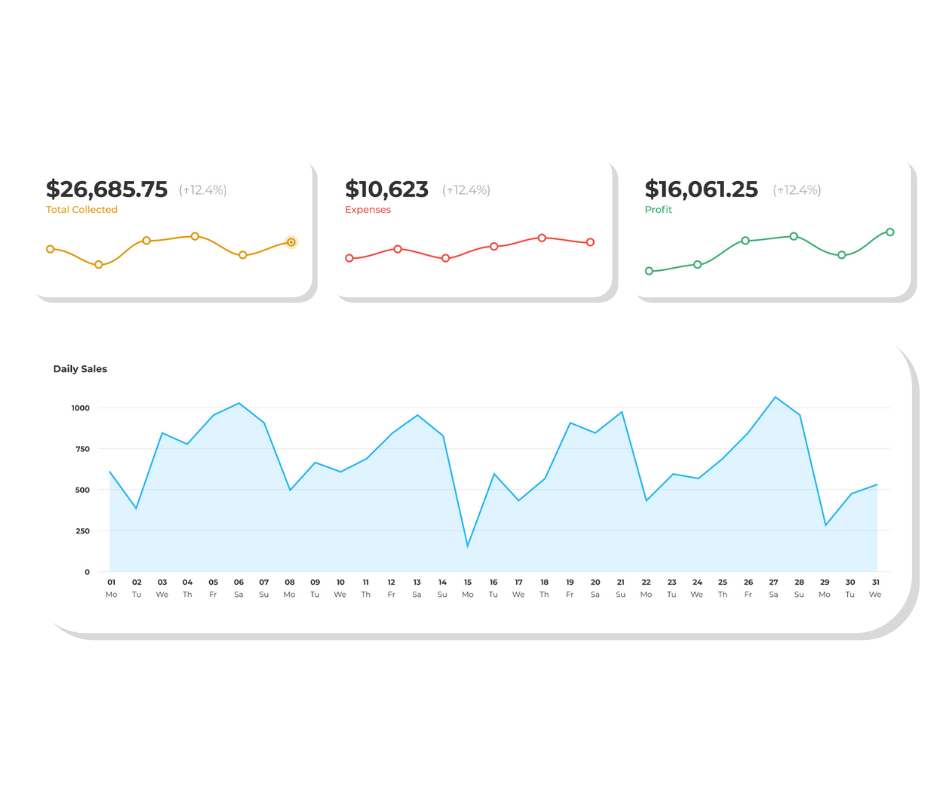
Cloud-Based Financials.
Real-Time. Always Accessible.
HQ Reporting gives operators instant access to all financial data — daily sales, revenue by channel, refunds, taxes, and net deposits — securely stored and accessible from any device.
- Daily, weekly, monthly, and annual sales views with one-click filters
- Revenue center breakdowns — filter by vendor, channel, or time of day
- Tax reporting at your fingertips — by revenue center or custom tax class
- Reconciliation reports aligned to settlement batches — no spreadsheet gymnastics
Know Which Items Sell — And Which Keep Customers Coming Back
Tabski's upcoming AI insights layer maps every menu item across two axes: sales volume and customer retention — surfacing your most valuable items, hidden gems, and dishes that are quietly costing you repeat visits.
- Most Valuable — high sales AND high retention, promote these relentlessly
- Needs Promoting — high retention but low volume, hidden gems worth pushing
- Negative Impact — items dragging down return visits, consider replacing
- Per-tenant visibility — every vendor sees only their own menu intelligence
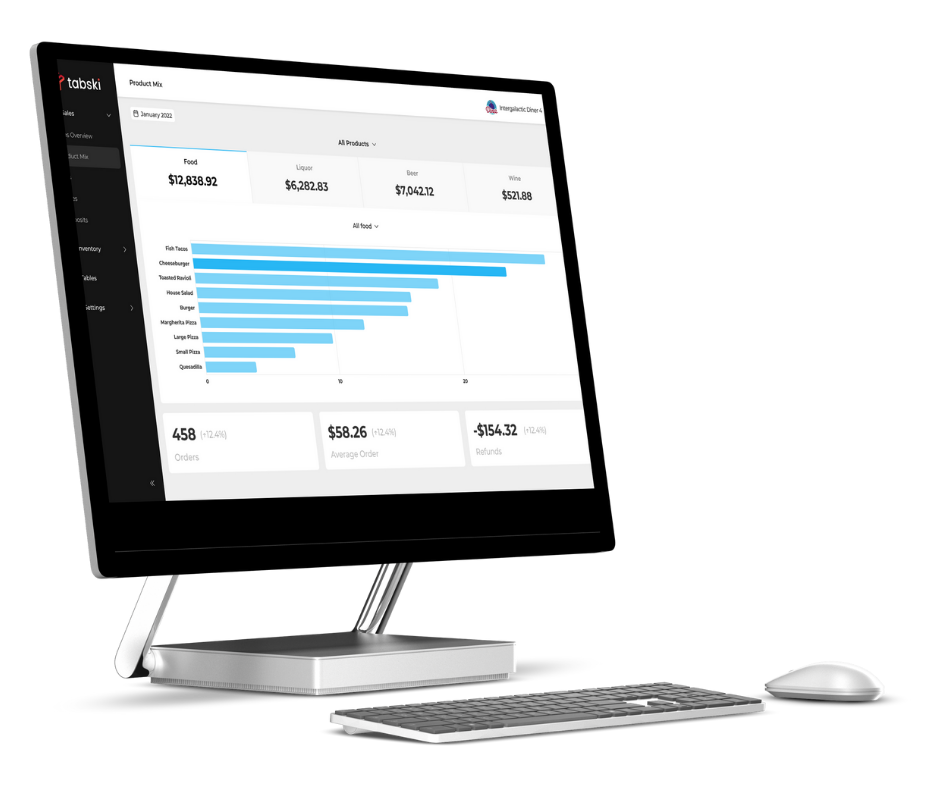
Know Your Best Sellers.
Promote What Works.
Tabski's product mix reporting shows which items and categories are driving the most revenue — so you can double down on winners, cut dead weight, and make smarter menu decisions every week.
- Item-level and category-level sales volume, ranked by revenue contribution
- View modifier performance — see which add-ons are actually being ordered
- Compare performance across time periods to spot trends and seasonality
View, Track & Manage
Your Business
Intuitive tips, taxes, and reconciliation built for operators who need answers fast — not another spreadsheet to maintain.

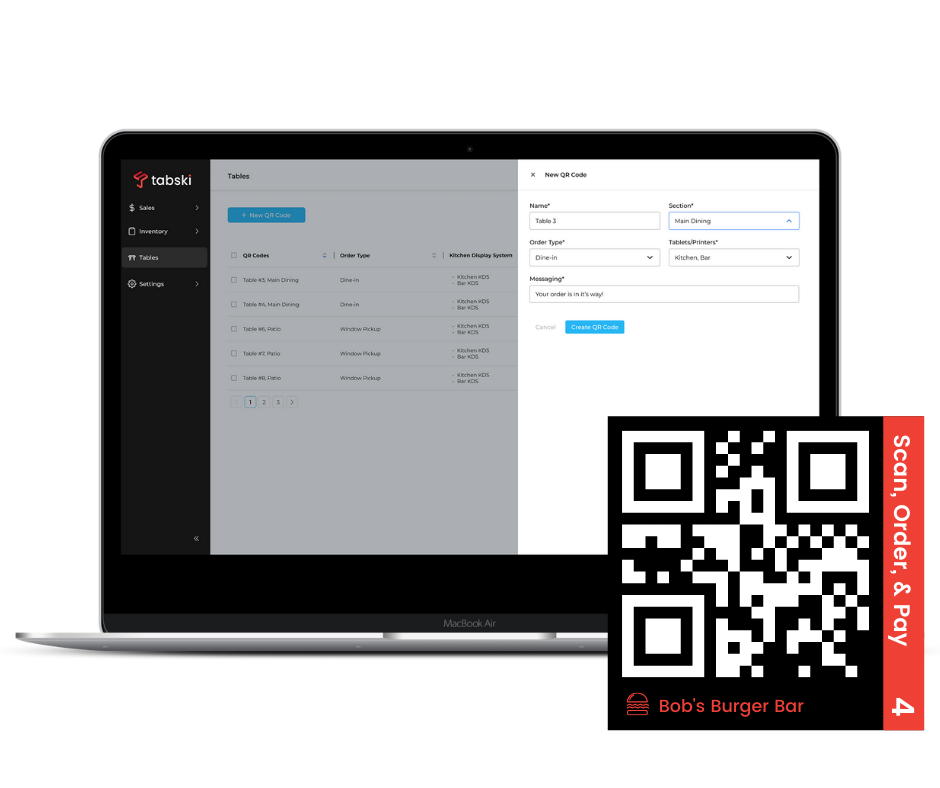
Create & Route QR Codes in Minutes
Create codes, assign them to specific printers and tablets, and customize guest-facing messaging — all from HQ. No dev work, no waiting.
- Assign each QR code to a specific printer and tablet destination in seconds
- Customize routing logic per table, section, or ordering area
- Timed menus — automatically enable or disable menus on your venue's schedule
- Update messaging on any QR code instantly — no reprinting required
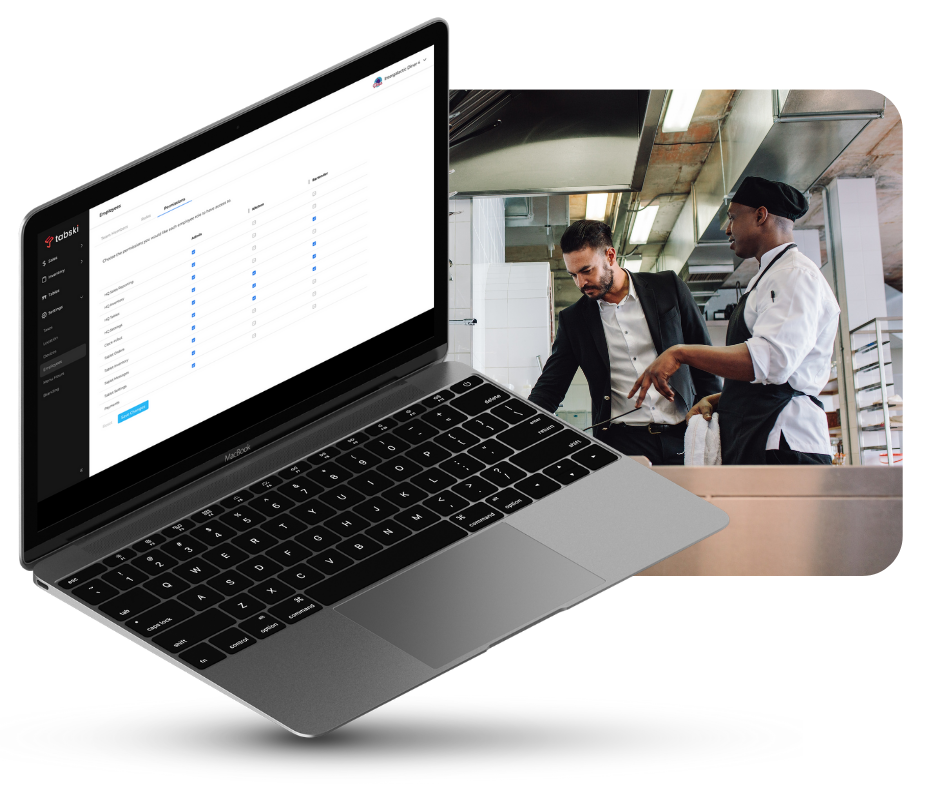
Stay in Control of Your Changing Staff
Set granular access controls across every Tabski product — floor staff see what they need, managers see more, and you see everything.
- Role-based permissions — set access by position across ordering, reporting, and admin tools
- Onboard new staff quickly — permissions apply across all active Tabski products automatically
- Audit employee activity — track order edits, voids, and discounts by staff member
- Instantly revoke access for offboarded employees — no shared passwords to rotate
100% Customizable.
Make It Yours.
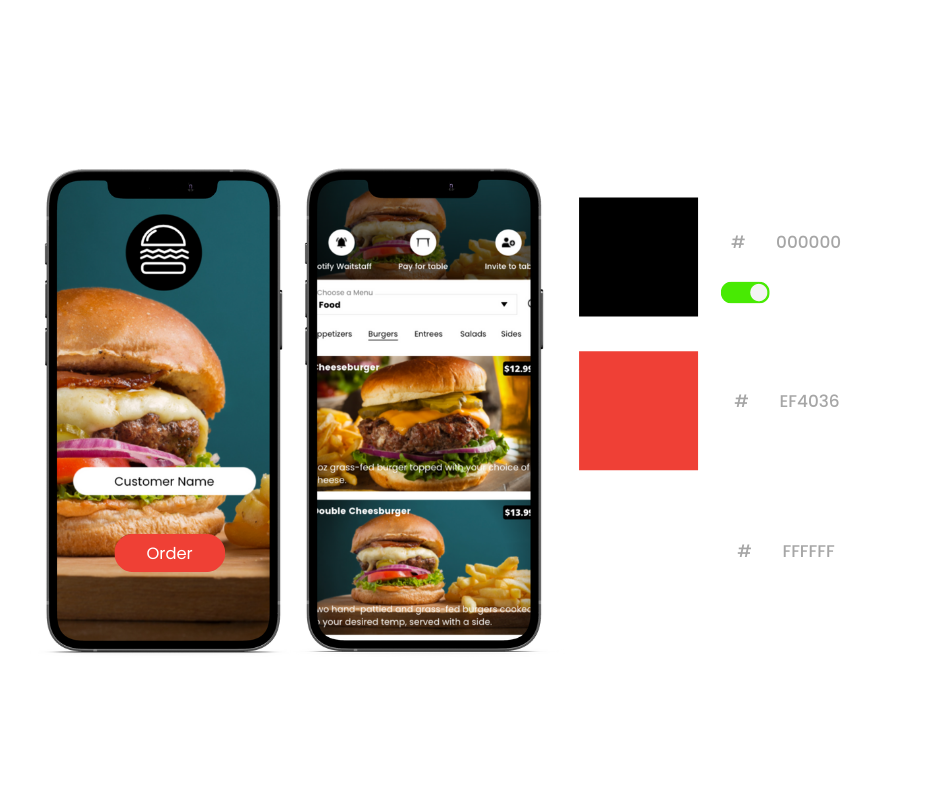
Upload your logo and color scheme to brand the entire guest-facing experience — your guests see your brand, not ours, across every digital touchpoint.
- Upload your logo and primary brand colors — applied across all digital touchpoints in minutes
- Per-tenant branding support — each vendor maintains their own identity within your hall
- Branded mobile app available — your loyalty program, your colors, your name in the App Store
Built for Operators Who Can't Afford to Guess
Every reporting tool you need to run a tighter, more profitable operation — without stitching together six different platforms.
Cloud-Based Access
All data securely stored and accessible from any browser on any device — laptop, tablet, or phone, wherever you are.
Timed Menus
Automatically activate and deactivate digital menus on a schedule — breakfast, lunch, and dinner transitions handled without staff intervention.
Live Menu Management
Update items, modifiers, and pricing in real time from HQ — changes push live to all terminals instantly, from anywhere.
Custom Branding
Upload your logo and brand colors once — applied across QR menus, online ordering, and mobile app interfaces automatically.
Tenant Batch Reports
Every vendor gets their own isolated report — gross sales, platform fees, rent deductions, and net payout in one clean document.
Role-Based Security
Granular permissions ensure staff only access what they need — from cashier to manager to operator, every role is scoped correctly.
Common Reporting Questions
Ready to See Your Business in Real Time?
Talk to a Tabski expert and get a live walkthrough of HQ Reporting — sales analytics, product mix, tenant reports, and more.